Confio Ignite: Part II
I’m continuing to evaluate Confio’s Ignite database monitoring tool. I’ve had it collecting data on a couple of production servers for about a week now. Based on what I’ve seen so far, it’s looking like a pretty good piece of software.
Breaking with the usual tradition, I’m going to talk about the things I’m not crazy about with the software, before I start singing its praises. The first thing, that I thought was missing, but is actually just hard to find, is the ability to look at the query information that Ignite collects, broken down by database. It looks like you should be able to get to it by looking at the Databases tab, but instead you have to first drill down into a time-period, then select specific databases within that time period, which will show you the queries by database. I know that in my environment, it’s this database listing of queries that is probably going to get used a lot. Tracking it down required help from the Confio team, which they quickly provided. They also showed me a way I could run queries to get this from their database so that I could create a report.
Speaking of reports, because they support Oracle & DB2 as well as SQL Server through their interface, no Reporting Services. OK, I recognize that I’m more than a bit Microsoft-centric when I say this, but I’d like to see SSRS reports so that I can manipulate things the way I want to. Again, not the end of the world, but it’s just something I don’t like. Because the data store is available though, I can get in there and create my own reports to my heart’s content and, if I like their report, I can always run a trace to capture the query and see how they built it so that I can build one of my own that mirrors it. I think they provide a mechanism for customizing reports by building some XML that will add it to the interface, which is a bit of a pain, but shows they’re on top of things.
One other thing that bothered me as I worked with Ignite is that, in the real time monitoring section, it was hard to find my way to the list of locks. It had the list, but it just wasn’t obvious how to get to them and this is something I’m used to looking at when I’m worrying about real time performance issues.
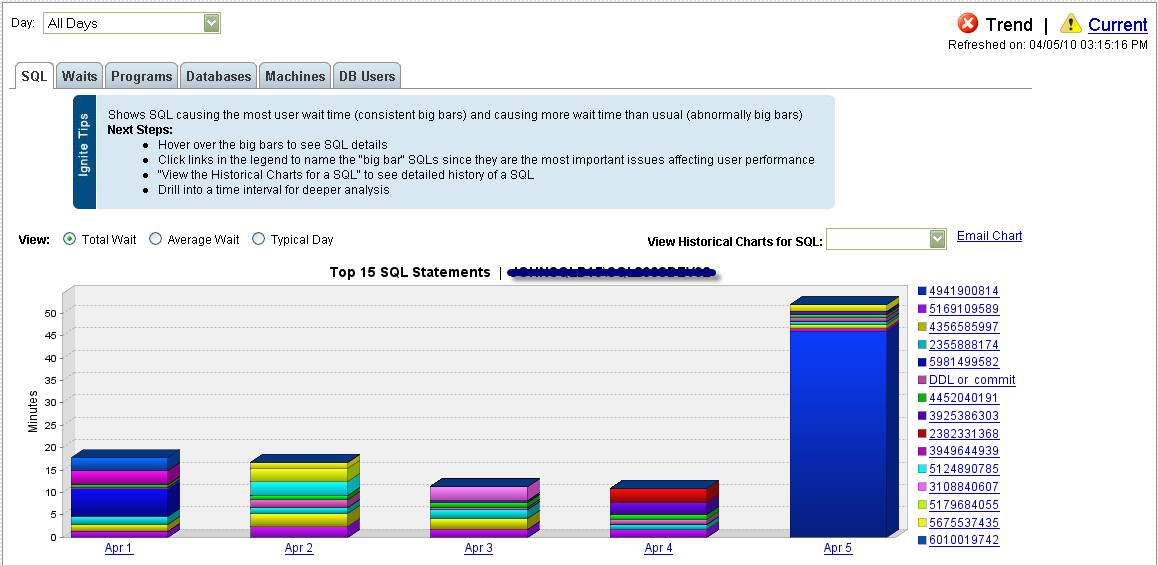
Right, enough talking about things I don’t like. See this? I love this:

That’s a break down, by database, by day, of the cumulative waits on the system. Yeah, that little pink database is causing all sorts of problems on one of my production systems. I actually already knew this was a problematic database, but I wasn’t that precisely aware of when and how it had issues. You can drill down to see the same thing for a given day:

And it’s not just the pretty pictures either, showing that most of our production load is in the morning, but that there are some odd spikes at midnight, 4AM & 7PM, but there’s data available behind the graph. If you drill down and hover over the graphs, pop-ups like this one appear:

(Names have been blacked out to protect my job)
And it’s the focus on wait times and types provided by the trending views and reports that make this a very strong tool. Ignite also collects pretty standard performance metrics, buffer cache hit ratio, memory paging, etc. And you can customize which of those metrics it collects and which ones you display, all on your own. But almost any decent monitoring tool does that. I use a tool that does that, and might even do that a bit better. No, what seperates this tool from the pack is that ability to identify the wait states and the query that is causing them. That’s what will get you excited when you’re using Ignite.
It also has a little ping mechanism that shows response time on the server, a helpful and friendly little reminder that all performance isn’t around what’s happening on SQL Server, but what’s happening across the enterprise.

Big chunks of the interface are customizable and you can add or drop things using the little icons on the right side of the picture above.
I can keep going with all the stuff that’s good, because it’s a long list, but I’ll summarize what I like so far. I like the focus on wait states, a lot. I like the focus on query performance. Between those two I feel like I’m getting the majority of what I need from the tool, and more than I get from other, similar, monitoring tools. The fact that it does all the other standard data collection on top feels like gravy. The problems I have with the software so far are either personal issues, Reporting Services, or fairly minor problems. I have a monitoring product running against the same servers as Ignite and I haven’t seen any impact from Ignite’s monitoring showing up there, so it looks like this is a benign monitoring software.
For my final installment, I’m going to look up the skirt of Ignite and see what the underlying data structure looks like. The ability to gather and present data is all well and good, but more important is the ability to take that data and make serious use of it through reports or by building other data structures out of it for long term storage and reporting.
Confio Ignite: First Impressions
One of the national sponsors for SQL Satuday is Confio Software. Just because they sponsor SQL Saturday, it’s worth checking out their product, but they also host the speaker’s dinner at these events. So, having eaten off their dime, I felt obligated to take a look. I’m glad I did.
Confio Ignite is a monitoring software that keeps real-time and historical track of the performance of your SQL Server (and Oracle and DB2) database servers. It’s focus is on wait states and queues, a very common method for troubleshooting performance.
You can get a trial download from their web site to run for a couple of weeks yourself. Everyone’s first impression of a software, after the web site of course, is when go to do the install. The install routine for Ignite was very easy. It’s also a bit of a shock. It actually uses web pages for configuration. This makes sense when you consider that the software originally comes from Oracle and Unix systems. Anyway, despite the bit of weirdness of using a web page for configuring software, it’s a very easy install. Once the install is complete, it’s also really simple to add servers for the software to monitor.
I put it to work on a number of development servers to start (I’m not plugging some unknown software into Production without a shake-down. I may be stupid, but I’m not crazy). It’s agentless and it began running queries against the systems immediately. It’s storing the data to my local desktop. That data is available in real-time, a historical view, or a trending view, showing how performance is changing over time. It’s all through a web site, not dissimilar to Quest’s Foglight. You can see a list of servers, their immediate state, action choices and some other general info.

Clicking a server, after it’s had time to gather data, put’s you into the Trend screen. It’s laid out very nicely. You get to break down performance by SQL, Waits, Programs, Databases, Machines, or Users. Then it shows information by Total Wait, Average Wait or Typical Day. The chart gives you a visual representation of queries running against the system, by default numbered and assigned by an internal hashing system that Ignite uses (no, I don’t know what the internals look like, I’m inferring that from the information presented). Down at the bottom of the screen you can see Top Query Problems, which shows you queries that are running slow or using too many resources according configurable settings, or Resources, your standard breakdown of CPU, Memory Paging, Disk Queue and the rest, or SQL Text, literally the queries that have been running on your system.

Almost everything has a drill down that takes you to a lot more information, and there are pop-ups that show you bits of detail.

I’ve only been running it for a few days, but I can already see how it could be very useful. I’m very happy with the focus on waits and on queries. So often when you’re looking at these tools queries are either an after thought or ignored completely. You frequently have to spend time monitoring your queries on your own, while that very expensive monitoring software is tracking page life expectancy and buffer cache hit ratio, both useful measures, but you still need to know which query is causing the problems. Ignite will get to that information right away and still collect the other as well.
So far, I’m pretty pleased with the software. I’m going to switch this over to a production system in the next few days and see what I can see with Ignite running against a real system. More to come.
nHibernate, First Look at TSQL
I’ve blogged in the past about the nHibernate project that has been going on at my company for the last eighteen months. Prior to today, I have only seen the database generated by nHibernate. But today I finally started seeing some TSQL code. My first impressions… oy!
There are two levels of concern coming out of the gate. First, it appears that some of the programming decisions, completely independent of nHibernate, are going to cause problems. Second, it appears we’re going to be hitting issues with nHibernate.
First, the programming decision. I’ve been using Confio to monitor this server for a few days now (look for upcoming posts on my eval of Confio). Only one day has captured any real activity from the nHibernate team (and yes, I’m basically spying on these guys because they are absolutely insistent that my team stay out of their way). The longest running query was two calls to this (names have been changed to protect my job, there are no innocents):
SELECT BookID
FROM Books WITH (updlock,rowlock)
WHERE BookID = 42
What they’re doing is locking the row so that no other user can get at it while it’s being edited. Total lock time for the first day was 38 seconds for two calls. I’ve posted about this previously, so I won’t go into it again, but this is potentially a disaster.
On to nHibernate. The next query was pretty benign:
SELECT OrgID
,OfficeID
,StartDate
,EndDate
,OtherID
FROM SpecialList
WHERE OfficeID = 42
Unfortunately this table, as created out of nHibernate, has no primary key, no clustered index or any other type of index, so this is just a table scan. But it’s only on 109 rows… in dev, not production, oh, and most of the 109 rows have a null value for OfficeID, but it’s all good I suppose… until I notice that this query also had 38 seconds of wait time, but it was called 394,652 times… oy (and no, I’m not even one of the chosen, but that’s a wonderful expression for this situation). Looking at the data in cache, this query has been called, since it was created in cache on the 2nd, 598351 times with a total elapsed time on the server of 5429689ms. The average then is 9ms, but the max was 29296 or 29 seconds.
The next query up looked like this:
SELECT col1
,col2
,col3
FROM Table1
INNER JOIN Table2
ON Table1.ChildID = Table2.OtherID
WHERE tabl2.ParentID IN (@p1,@p1,@p2…@p99)
Yep. 99 parameters passed and used against an IN statement. I can’t post the execution plans on this stuff without talking it over with the boss, but suffice to say, it’s two table scans and a merge join to get the data back. Oh, and this was called 1,138 times with a minimum elapsed time of 976ms. Yeah, minimum time to call this proc is 1 second and it’s been called over a thousand times.
It went down hill from there. I’m looking at other queries, one that hits seven tables, but instead of using JOINs uses a bunch of sub-selects in the WHERE clause. It has a minimum run time of 9 seconds. Luckily it’s only been called 64 times.
This is a horror show.
A lot of benefit can be reaped if we’re able to go in and create some indexes on these tables, but that’s going to be an issue anyway because I’m seeing lots of implicit data conversions on the parameters being passed in, as I noted a couple of years ago. At this point in time, I would say, at best, I’m very underwhelmed by what nHibernate is producing. To be perfectly honest, I’m concerned for the health of the project.
Editorial on SQL Server Central
My first one over there. It’s discussing whether or not you should do two things, build your own monitoring tool, come out in particular favor of one tool or suite of tools from a single vendor. Please read it and watch the video. And, even more importantly, leave a comment in the discussion.
LaRock on Monitoring
Since I just spent a bit more than half of my 24 Hours of PASS presentation on tuning queries talking about monitoring performance, you could probably tell that I think that the two are inextricably linked. I’m not alone. Tom LaRock has put a post on why it’s important to understand the extent of your problem prior to attempting to fix it. It’s absolutely spot-on and a must read.
Remember, if someone says performance on a system you manage is slow, you have to ask, as compared to what? You need to understand what “normal” performance is on your system in order to arrive at the ability to identify a particular process as performing in an abnormal manner. That’s not to say that you couldn’t tune a query in complete isolation to a baseline of performance. Of course you could. The question that Tom is answering is, are you tuning the right query for the right reasons?
Oh, and for those that are interested, some of the presentations made during 24 Hours of PASS are now available for download. The rest of the sessions will be available after the Summit. If you haven’t made plans to go, I’d get on over there now and register.
Debuting: Beginning SQL Server 2008 Administration
The new book is up on Amazon. I only worked on three chapters of Rob Walter’s new book and that was after begging to only work on two, so I can’t take much credit for the effort that went into this book. However, thanks to our editor Jonathan Gennick, I was privileged to work with Rob & Carmen, if pretty indirectly. I know I mentioned the book before when it was put up on the Apress web site, but this is Amazon. Once it’s up on Amazon, it’s real.


